Introduction
Context
To meet the Paris temperature targets and recover from the effects of the pandemic, many countries have launched economic recovery plans, including specific elements to promote clean energy technologies and green jobs. However, how to successfully manage investment portfolios of green recovery packages to optimize both climate mitigation and employment benefits remains unclear.
Methodology
We used three energy-economic models, combined with a portfolio analysis approach, to find optimal low-carbon technology subsidy combinations in six major emitting regions: Canada, China, the European Union (EU), India, Japan, and the United States (US). Specifically we:
- applied increasing subsidy rates individually for nine clean technologies on top of region specific (pre-pandemic) energy and climate policies;
- measured the marginal effectiveness in reducing emissions and increasing employment using three IAMs that differ significantly in their solution mechanisms and temporal dynamics (GCAM, GEMINI-E3, TIAM);
- used a robust portfolio analysis for each region-model combination to find a Pareto-optimal set (i.e., a set of points where no improvements are possible in one metric without affecting at least one other metric) of technology portfolios.
The obtained Pareto frontiers are then used to identify trade-offs between the cumulative amount of CO2 emissions abated, the number of job-years created over this entire decade (2021–2030), and the number of short-term job-years created up to 2025.
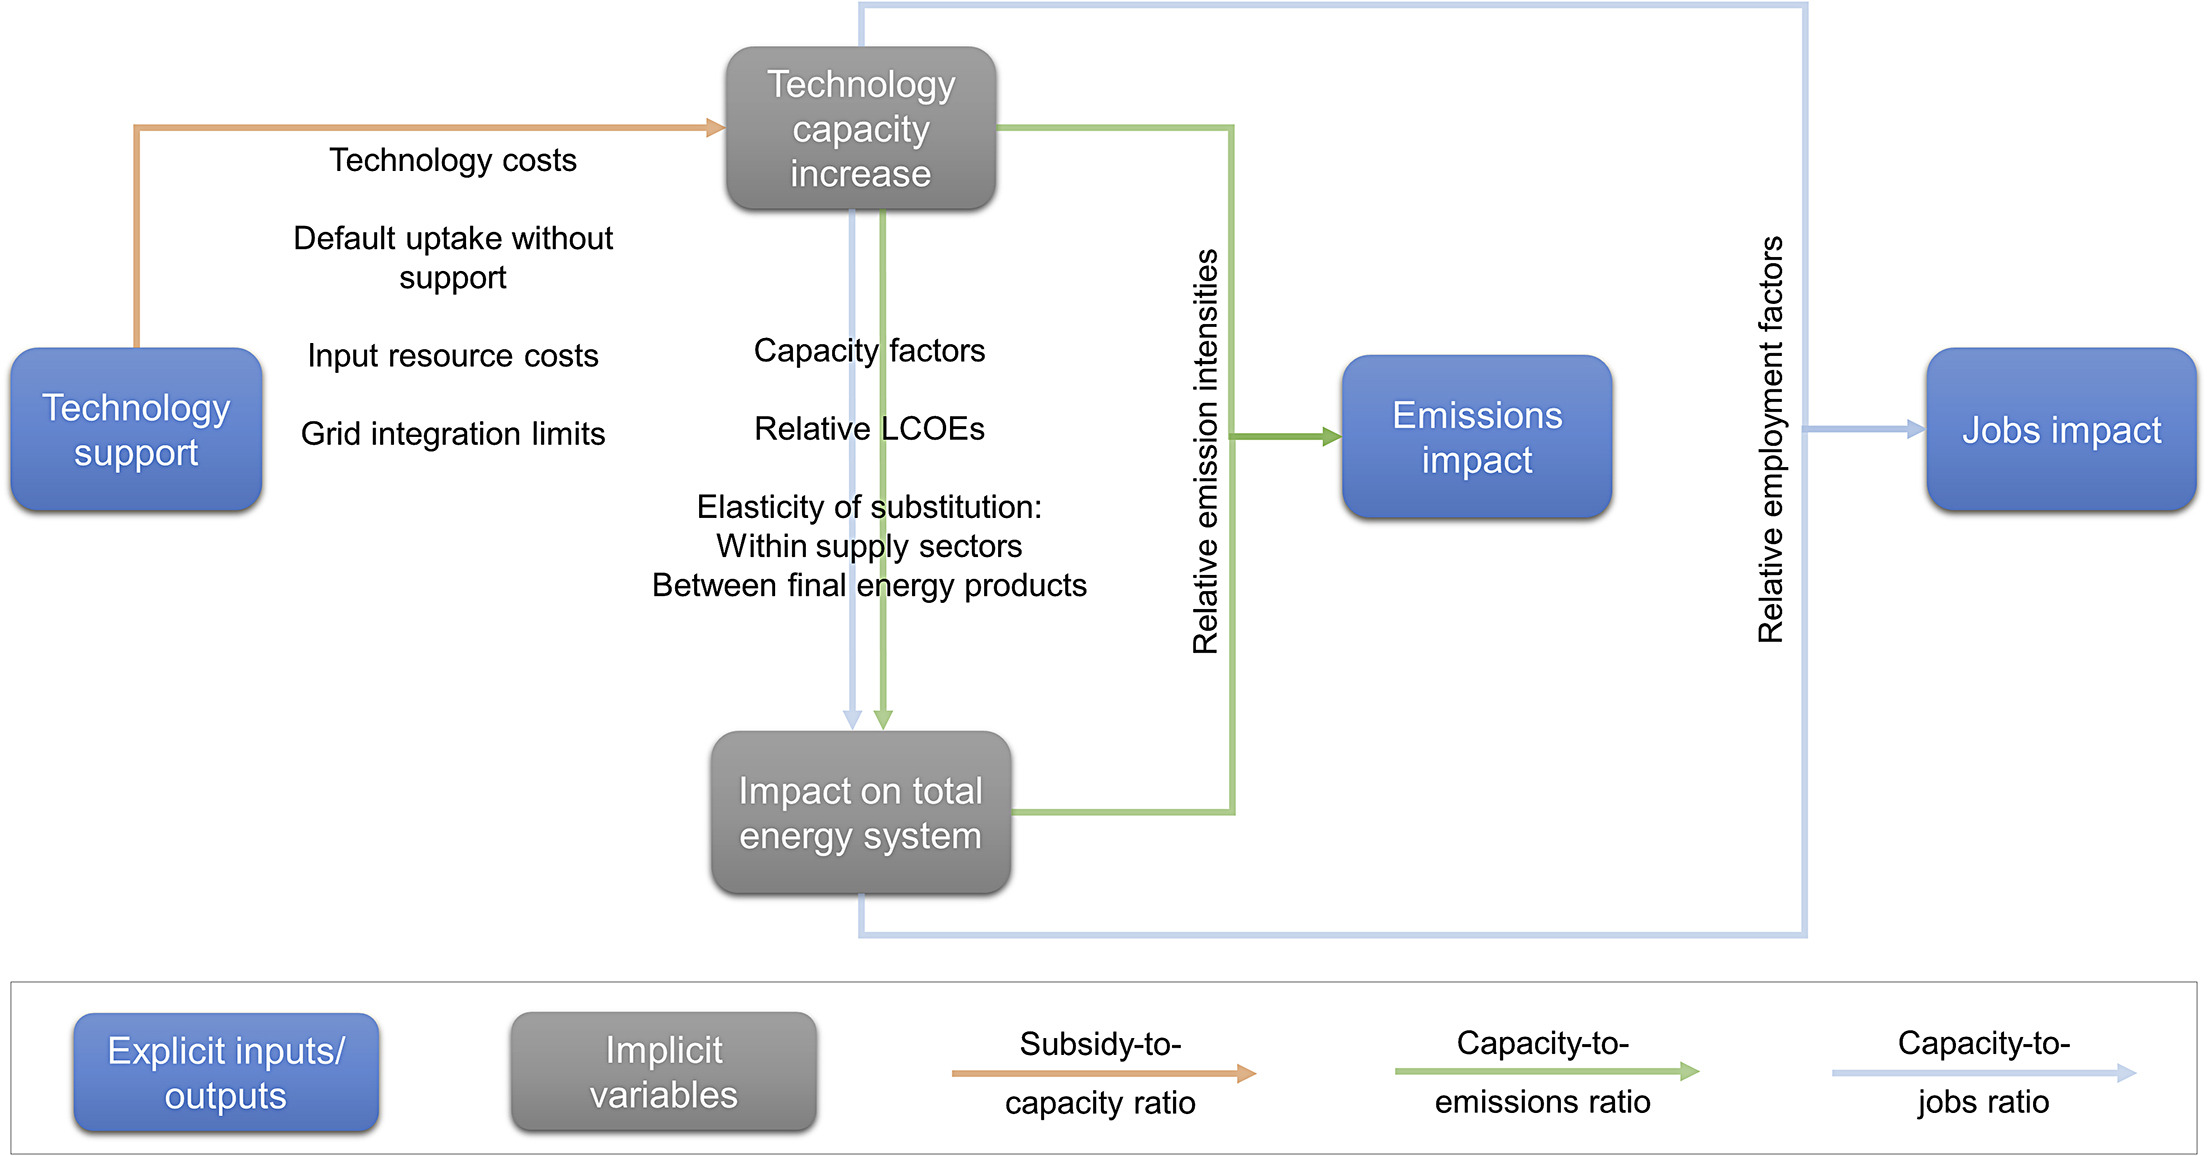
The figure below provides a schematic overview of how technology support may affect emissions and employment.
Policy Questions
What are the impacts of the optimal allocation of COVID-19 recovery packages over power-sector technologies?
Results indicate that the optimal allocation of COVID-19 recovery packages over power-sector technologies in China and the EU have the potential to significantly contribute to their respective 2030 mitigation targets, compared with where the two regions would be headed given their current policy efforts and absent any recovery finance spending.
- For China, the optimal allocation of the available recovery funds in a portfolio of clean energy supply technologies can cut up to two times the CO2 emissions gap of the country’s 2030 nationally determined contribution (NDC) target of reducing the carbon intensity of its economy by at least 65% relative to 2005, while in the same period covering 4%–22% of the jobs lost due to COVID-19.
- For the EU, and depending on the three models’ emissions trajectories, optimal recovery spending could help approach the ‘‘Fit for 55’’ CO2 emissions target (i.e., reduce CO2 emissions by at least 55% by 2030, against 1990 levels) by 7%–48%, while mitigating the pandemic-related job losses by up to around 9% by the end of the decade.
- Packages in the United States and India are measured to contribute significantly less, with contributions in the range of 0%–3%.
- The expected impact of packages in Canada lies in between, while results for Japan are inconclusive due to stronger model variation.
You can select a country/region in the dropdown menu to see numeric results for each country.
CO2 emissions cuts

The chart will present the impacts of COVID recovery packages on CO2 emissions cuts.
Loading...
Jobs by 2025

The chart will present the impacts of COVID recovery packages on energy sector jobs by 2025.
Loading...
Jobs by 2030

The chart will present the impacts of COVID recovery packages on energy sector jobs by 2030.
Loading...
Relative results for emissions cuts: We first calculate the difference in cumulative 2021–2030 emissions of each region on model in the current policies baseline with emissions in the latest 2030 NDC submissions, and then divide the recovery package abatement by this emissions gap. Assumed NDC targets (applied to CO only) are 55% w.r.t. 1990 in the EU, 65% emissions intensity w.r.t. 2005 in China, 51% w.r.t. 2005 in the United States, 45% emissions intensity w.r.t. 2005 in India, 46% w.r.t. 2013 in Japan, and 42.5% w.r.t. 2005 in Canada. No results appear for model-region combinations where the current policy baseline already achieves the latest NDC target.
Relative results for jobs: First the number of new unemployed in 2021 relative to 2019 is calculated by multiplying the unemployment rate by total labor force; we focus on unemployment in 2021 instead of 2020 to filter out large temporal unemployment driven by hard lockdowns during 2020). Then it divides the amount of recovery package job-years in the energy sector by 10 (2021-2030) and 5 (2021–2025) and divides it by the total amount of new unemployed.
Which technology portfolios maximize greenhouse gas emissions cuts and jobs?
Obtained optimal portfolios suggest that, when optimally allocating recovery funds between emission reduction and employment creation objectives, most countries would invest:
- over 50% of their energy-focused green recovery packages in financing PV,
- over 10% in onshore wind,
- while investments in other clean energy technologies strongly depend on the country, preferred objective, and model applied.
Overall, our results suggest that the recovery response to the COVID-19 pandemic can provide a strong green stimulus in which economic recovery is aligned with improved mitigation efforts.
You can select a country/region in the dropdown menu to see numeric results for each country in the figure below. For each objective independently, we isolated the top 5% of portfolios that maximize that objective. We then used the robustness of each portfolio as a weight and calculated the weighted average of their investment mixes (in the top 5%), to create an ideal portfolio that represents the best-performing solution for each distinct objective.

The chart will present optimal technology portfolios.
Loading...


