Co-creation process
As part of the PARIS REINFORCE research project, a regional workshop took place on November 21, 2019, in Brussels, Belgium For the co-production of research underpinning new climate policy in Europe. Stakeholders were invited based on their displayed participation or interest in previous European climate policy events, resulting in a sample of over 800 invitations. During the workshop, high-level staff of the EC directorates-general (DGs) for energy, climate and research, ministries and climate-related governmental bodies from EU Member States, international organisations, business representatives, and scientists participated.
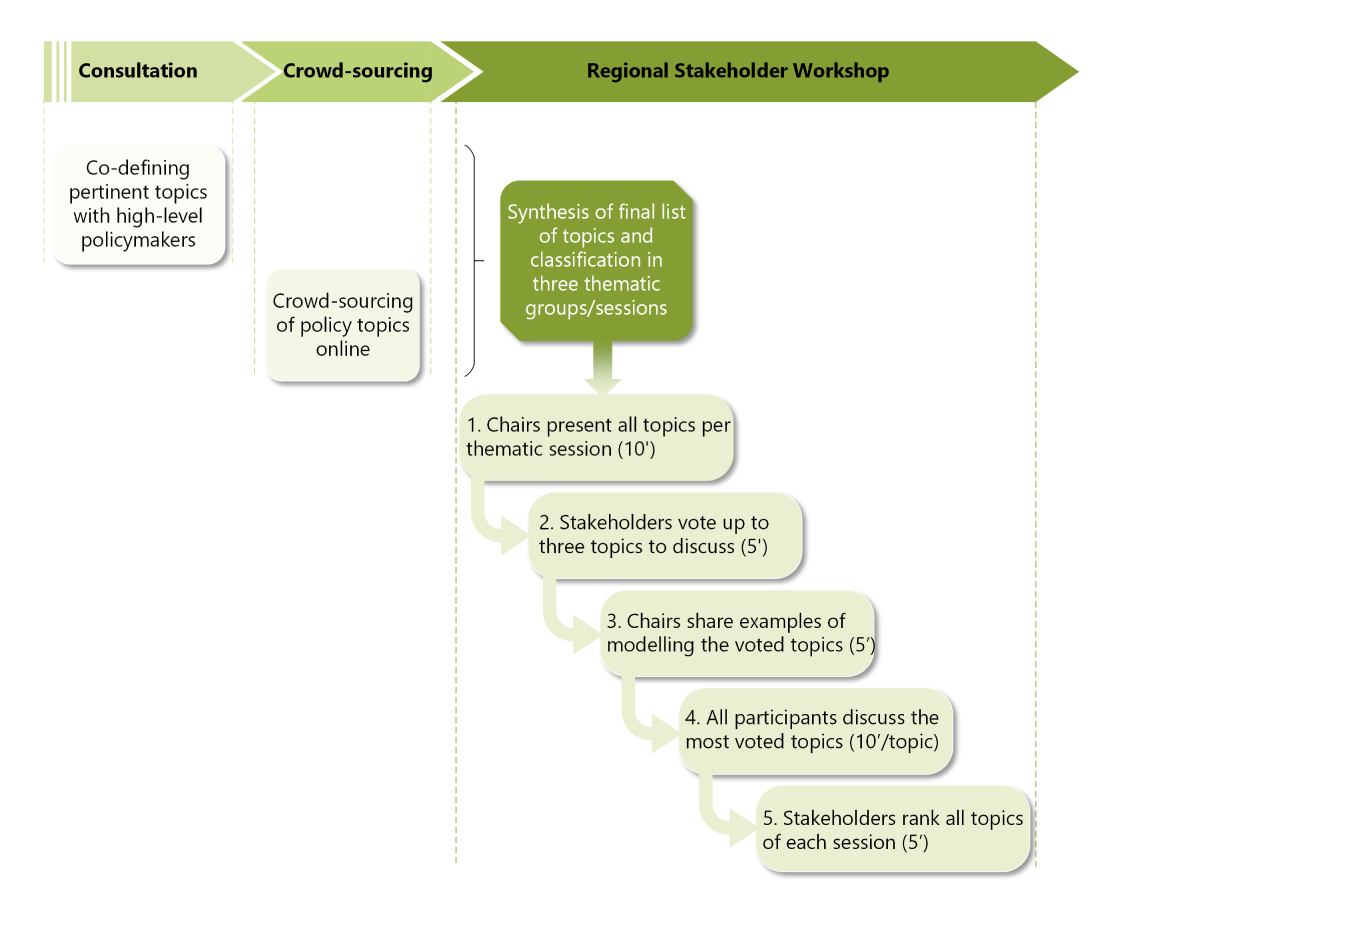
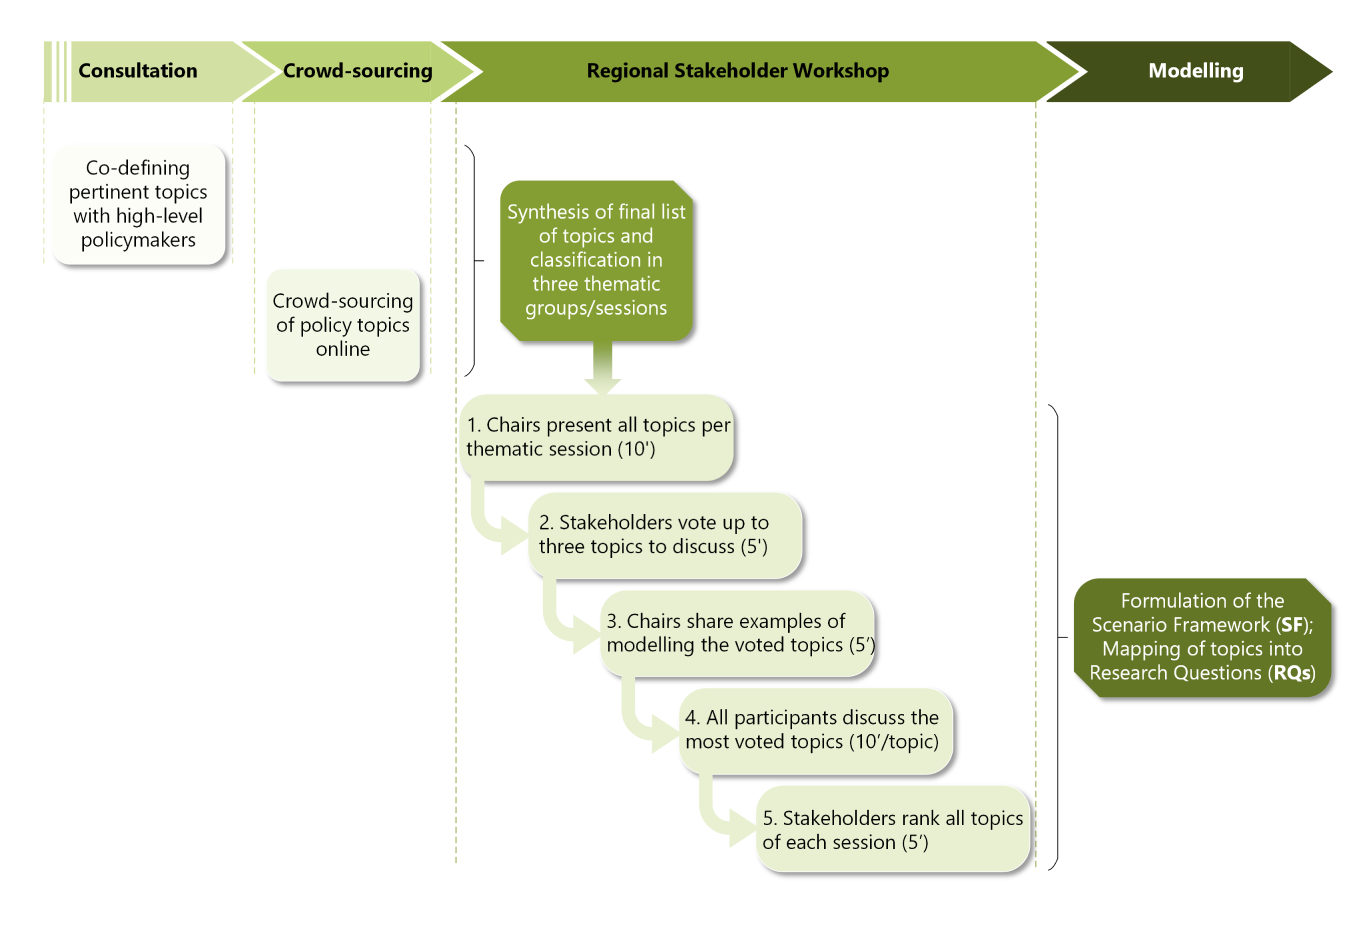
The consultation, along with an open crowd-sourcing process carried out via an online polling platform 24 h before the event, resulted in a list of 22 topics, which were broken down into 3 thematic groups.
57 individuals attended the workshop physically, although the event was also livestreamed to allow as large and diversified an audience as possible.
Given the range of proposed questions, participants were given the option to vote (via sli.do1) on and prioritise which questions they would be most interested in discussing. After topic selection, the floor was open for discussion between chairs and audience. Chairs spent 1–2 min introducing the discussion on each topic, and then stakeholders were able to raise any points or questions they had over the proposed research areas. Following the discussion, sli.do voting again allowed stakeholders to vote according to how relevant they see it for the project to follow up on and conduct research in each topic. The process is illustrated below.


Policy Questions
Where is Europe headed towards in 2050?
From 1990 to 2015, annual CO2 emissions in the EU have decreased an average of 0.9% per year.
- Between 2020 and 2030, models project a reduction of CO2 emissions reaching in 2030 -33% to -45% of CO2 emissions compared to 1990.
- GHG emissions reduction in 2030 will range between −39% and −51%, compared to 1990 levels.
- These figures are insufficient to comply with the new EU Green Deal objective of a 55% GHG reduction target.
- These figures show the EU will reach the former −40% milestone, but not yet the new EU Green Deal objective of a 55% GHG reduction target.
In 2050, the median EU CO2 emissions are about 2.1 Gt, with a broad range of about 1.0–2.35 Gt, representing a CO2 emissions drop of −43% to −76% compared to 1990.
Total CO2 emissions
(in the EU across models until 2050)

- PR_CurPol_CP: Current policies evolving with GDP per capita growth (E3ME, GCAM, Gemini-E3, ICES, MUSE, TIAM)
- PR_CurPol_EI: Current policies evolving with 2020-2030 GDP reduction rate (42)
- PR_NDC_CP: NDCs evolving with GDP per capita growth (EU-TIMES, NEMESIS)
Variability between models comes from the different mitigation options available, key technologies (e.g. Carbon Capture and Storage (CCS)), markets and national policies.
When looking into sectors, PR’s EU model ensemble results indicate that:
- Energy supply is the largest contributor of emissions cuts between 2020 and 2050 in almost all models (with an average of 47%).
- On the contrary, median decarbonisation rates in industry (42%), buildings (30%) and transport (32%) differ significantly across models, with industrial CO2 emissions displaying the largest variability.
- The two sector-specific models, FORECAST (buildings and industry) and ALADIN (transport) show significant emissions cuts in their sectors, compared to other models.
Energy CO2 emissions
(by sector)

Different columns in the same time period represent different models and their results for the CO2 emissions.
What is the role of Carbon Capture and Storage (CCS)?
In the policy domain and among specific technologies used in modelling scenarios, CCS is considered a possible option for reducing CO2 emissions, particularly from hard-to-decarbonise sectors, like heavy industries and energy transformation.
However, there are still important barriers, that hinder the large-scale development of these technologies. As seen in the following graph, global, drastic emissions reduction currently depend significantly on these technologies mainly post-2040, although to different extents for each model.

On average, contribution of Bioenergy with carbon capture and storage (BECCS) in these models represents approximately 50% of captured CO2 in 2030 and 56% in 2050.
CO2 captured by CCS
(by sector)

- Limited role of the technology in GEMINI-E3 and NEMESIS reflecting limited decarbonisation resulting from current policy efforts and GEMINI-E3 due to less detailed representation of the technology in power generation).
- E3ME and EU-TIMES show a lower rate of CCS penetration in electricity generation.
- Global, technology-rich models TIAM, GCAM and MUSE deliver high capture rates.
Different and more ambitious policy efforts may completely change the role of CCS in the longer run.
CCS is a critical factor and game-changing enabler of the deep decarbonisation foreseen, but it becomes so only upon hitting high decarbonisation levels (40–60%).
CO2 captured by CCS
against CO2 reduction levels
(since 1990, based on European Environmental Agency, 2019)

Our results justify stakeholders’ concerns over the potential failure of CCS as a game changer in the EU energy system. We see that, without setting in motion actions to deliver on the EU’s increased climate ambitions, as reflected in its December 2020 NDC and broader mid-century vision for climate neutrality, CCS deployment is critical to achieving deep emissions cuts and eventually nearing climate targets. Our results should be interpreted alongside the adopted scenario framework; different policy efforts may completely change the role of CCS even in the longer run.
What is the role of import dependency in Europe?
Currently the EU is a net importer of fossil fuels, but reducing emissions and a transition to renewables will allow the EU to become less reliant on import dependency.
Some Member States have acknowledged the importance of improving energy efficiency, reducing overall gross inland consumption while also targeting more ambitious policies toward increasing domestic renewables.
Imported fuels
(until 2050)

A reduction in coal and oil imports is also expected in 2050, but model results differ regarding the future of gas imports. Gas imports increase in EU-TIMES and GEMINI-E3, while in TIAM tends to reduce in the long run but retain some important role in the transition.
Import dependency
(in relation to CO2 emissions reduction levels)

In TIAM, import dependency decreases in time, in line with the higher decarbonisation efforts compared to the other two models, thereby attesting to future low-carbon energy systems relying less and less on imports, substituted primarily by energy savings and domestic energy resources.
What will the role of electrification be in the transport sector?
EU transport sector electrification
(in relation to CO2 emissions reduction levels)

All models illustrate increasing electrification through decarbonization, though at differing rates.
Sectoral models, delving deeper into the energy system, indicate that a 39% decrease in CO2 emissions is expected compared to 1990 values due to the electrification in the transport sector.


Both in Europe and globally, the transport sector plays a critical role in transition.
Global transport emissions have been increasing, making up a quarter of direct CO2 emissions from fuel combustion. In the EU, although transport emissions have stabilised after steady growth until 2007, they still make up 29.6% of total direct CO2 emissions from fuel combustion.
Electric vehicles (EVs) are considered a valuable option to reduce direct emissions and energy intensity of road mode, and their deployment is steeply growing.
EU transport sector electrification
(in final energy consumption until 2050)

Different columns in the same time period represent different models and their results for energy consumption in the transport sector.
What is the future of hydrogen in the EU?

In a low-carbon future, hydrogen is generally expected to grow in order to sustain the decarbonisation of hard-to-electrify demand sectors, like heavy-duty transportation, navigation, aviation, and energy-intensive industries, or used for energy storage sustaining the uptake of large renewable energy shares (RES) in the power sector.
Hydrogen can be produced through a variety of processes and its manufacturing can be energy-intensive and associated with a wide range of emissions, depending on the technology used.
Generally hydrogen production can be divided into fossils based or renewables based.
Brown hydrogen is produced via coal gasification, grey hydrogen is from natural gas, blue hydrogen uses CCS technologies for the greenhouse gases produced via grey hydrogen and green hydrogen production uses renewable energy.
For a more detailed analysis on Hydrogen Production see the European Commission's communication.
Hydrogen production capacities
(by fuel type)

Different columns in the same time period represent different models and their results for hydrogen production.
Most hydrogen production in 2030 is expected to be grey. By 2050, models show conversion to blue hydrogen, underpinning the increase of natural gas in the energy system with reliance on CCS technologies.
These findings indicate that current policies are not enough to drive a complete change from grey to green hydrogen in EU by 2050.
Hydrogen/ electricity comparison
(in final transport and industry demand)

Different columns in the same time period represent different models and their results for hydrogen/ electricity comparison in industry demand.
In industry, future scenarios based on current policies also indicate that the share of hydrogen in total final energy demand is negligible in comparison to the role of electricity, estimated at around 1% of total sector consumption in 2030 and 3.5% in 2050.

Different columns in the same time period represent different models and their results for hydrogen/ electricity comparison in transport demand.
In transport, only TIAM shows important hydrogen deployment, delivering 7% of total consumption in 2030 and 17% in 2050. In all other models, hydrogen remains a niche technology achieving in 2050 an average of 0.7% of consumption.
What are the costs and gains of current policies?
Extrapolating into the future
GDP projections are different across model results due to model characteristics and logic.

The two global computable general equilibrium (CGE) models (GEMINI-E3 and ICES) show negative GDP impacts of current policy efforts, relative to their no policy scenario.
The two macroeconometric models, on the other hand, display different behaviour: NEMESIS shows negligible GDP impacts, while E3ME projects positive impacts on GDP.


Both NEMESIS and E3ME models reveal positive impact of a long-term projection of current policy efforts on total employment.
Despite differences in the levels of investments overall, top-down macroeconomic models (GEMINI-E3, NEMESIS, E3ME) show moderate changes between 2020 and 2050. On the other hand, the technology-richer models (EU-TIMES, GCAM) project an acceleration of European investments in the power sector from 2020 to 2050, with both models showcasing a 2.5-fold increase.

